Deprecation Note
We published the last version of Graylog Documentation before the release of Graylog 4.2. Now, all documentation and help content for Graylog products are available at https://docs.graylog.org/.
There will be no further updates to these pages as of October 2021.
Do you have questions about our documentation? You may place comments or start discussions about documentation here: https://community.graylog.org/c/documentation-campfire/30
Sending in log data
A Graylog setup is pretty worthless without any data in it. This page explains the basic principles of getting your data into the system and also explains common fallacies.
What are Graylog message inputs?
Message inputs are the Graylog parts responsible for accepting log messages. They are launched from the web interface (or the REST API) in the System -> Inputs section and are launched and configured without the need to restart any part of the system.
Content packs
Content packs are bundles of Graylog input, extractor, stream, dashboard, and output configurations that can provide full support for a data source. Some content packs are shipped with Graylog by default and some are available from the website. Content packs that were downloaded from the Graylog Marketplace can be imported using the Graylog web interface.
You can load and even create own content packs from the System -> Content Packs section of your Graylog web interface.
Syslog
Graylog is able to accept and parse RFC 5424 and RFC 3164 compliant syslog messages and supports TCP transport with both the octet counting or termination character methods. UDP is also supported and the recommended way to send log messages in most architectures.
Many devices, especially routers and firewalls, do not send RFC compliant syslog messages. This might result in wrong or completely failing parsing. In that case you might have to go with a combination of raw/plaintext message inputs that do not attempt to do any parsing and Extractors.
Rule of thumb is that messages forwarded by rsyslog or syslog-ng are usually parsed flawlessly.
Sending syslog from Linux hosts
rsyslog
Sending syslog data from Linux hosts with rsyslog is done by defining an output Action that uses
the RFC 5424 format.
The output action can be placed at the end of the /etc/rsyslog.conf or as an included file such as /etc/rsyslog.d/graylog.conf.
These examples will send all syslog selectors
to the example host yourgraylog.example.com (change this to the hostname or IP that resolves in the installed environment) on port 514
using the predefined format of RSYSLOG_SyslogProtocol23Format.
UDP (single @):
*.* @yourgraylog.example.org:514;RSYSLOG_SyslogProtocol23Format
TCP (double @@):
*.* @@yourgraylog.example.org:514;RSYSLOG_SyslogProtocol23Format
This can be improved by configuring rsyslog to use TLS.
An opinionated example configuration using a local queue, TCP with TLS, recycling connections, and using the rsyslog advanced format:
*.*  action(
   Action.resumeInterval="10"
   RebindInterval="10000"            # cycling TCP connections allows for load balancing
   Queue.Size="100000"
   Queue.DiscardMark="97500"
   Queue.HighWaterMark="80000"
   Queue.Type="LinkedList"
   Queue.FileName="rsyslogqueue"
   Queue.CheckpointInterval="100"
   Queue.MaxDiskSpace="2g"
   Action.ResumeRetryCount="-1"
   Queue.SaveOnShutdown="on"
   Queue.TimeoutEnqueue="10"
   Queue.DiscardSeverity="0"
   type="omfwd"
   target="yourgraylog.example.org"
   protocol="tcp"
   port="514"
   template="RSYSLOG_SyslogProtocol23Format"
   StreamDriver="gtls"
   StreamDriverMode="1"               # run driver in TLS-only mode
   StreamDriverAuthMode="x509/name"   # host TLS cert CN will be used for authentication
   StreamDriverPermittedPeers="yourgraylog.example.org" # only allowed hosts
)
For extremely old (pre-5.10 from 2010) versions of rsyslog that do no have the RSYSLOG_SyslogProtocol23Format built-in,
a template must be defined:
$template GRAYLOG_SyslogProtocol23Format,"<%PRI%>%PROTOCOL-VERSION% %TIMESTAMP:::date-rfc3339% %HOSTNAME% %APP-NAME% %PROCID% %MSGID% %STRUCTURED-DATA% %msg%\n"

# Then referenced in the output action
*.* @graylog.example.org:514;GRAYLOG_SyslogProtocol23Format
syslog-ng
Use the syslog function in syslog-ng to send RFC 5424 formatted messages via TCP to a Graylog host:
# Define TCP syslog destination.
destination d_net {
    syslog("graylog.example.org" port(514));
};
# Send from the default source s_src to the d_net destination configured above.
log {
    source(s_src);
    destination(d_net);
};
Sending syslog from MacOS X hosts
Sending log messages from MacOS X syslog daemons is easy. Just define a graylog-server instance as UDP log target by
adding this line in your /etc/syslog.conf:
*.* @graylog.example.org:514
Now restart syslogd:
$ sudo launchctl unload /System/Library/LaunchDaemons/com.apple.syslogd.plist
$ sudo launchctl load /System/Library/LaunchDaemons/com.apple.syslogd.plist
Important: If syslogd was running as another user you might end up with multiple syslogd instances and strange
behavior of the whole system. Please check that only one syslogd process is running:
$ ps aux | grep syslog
lennart         58775   0.0  0.0  2432768    592 s004  S+    6:10PM   0:00.00 grep syslog
root            58759   0.0  0.0  2478772   1020   ??  Ss    6:09PM   0:00.01 /usr/sbin/syslogd
That’s it! Your MacOS X syslog messages should now appear in your Graylog system.
GELF / Sending from applications
The Graylog Extended Log Format (GELF) is a log format that avoids the shortcomings of classic plain syslog and is perfect to logging from your application layer. It comes with optional compression, chunking and most importantly a clearly defined structure. There are dozens of GELF libraries for many frameworks and programming languages to get you started.
Read more about GELF in the specification.
GELF via HTTP
You can send in all GELF types via HTTP, including uncompressed GELF that is just a plain JSON string.
After launching a GELF HTTP input you can use the following endpoints to send messages:
http://graylog.example.org:[port]/gelf (POST)
Try sending an example message using curl:
curl -XPOST http://graylog.example.org:12202/gelf -p0 -d '{"short_message":"Hello there", "host":"example.org", "facility":"test", "_foo":"bar"}'
Both keep-alive and compression are supported via the common HTTP headers. The server will return a 202 Accepted when the message
was accepted for processing.
Using Apache Kafka as transport queue
Graylog supports Apache Kafka as a transport for various inputs such as GELF, syslog, and Raw/Plaintext inputs. The Kafka topic can be filtered by a regular expression and depending on the input, various additional settings can be configured.
Learn how to use rsyslog and Apache Kafka in the Sending syslog via Kafka into Graylog guide.
Using RabbitMQ (AMQP) as transport queue
Graylog supports AMQP as a transport for various inputs such as GELF, syslog, and Raw/Plaintext inputs. It can connect to any AMQP broker supporting AMQP 0-9-1 such as RabbitMQ.
Learn how to use rsyslog and RabbitMQ in the Sending syslog via AMQP into Graylog guide.
Microsoft Windows
Sending syslog data from Windows is described on the Graylog Marketplace.
Ruby on Rails
This is easy: You just need to combine a few components.
Log all requests and logger calls into Graylog
The recommended way to send structured information (i.e. HTTP return code, action, controller, … in additional fields) about every request and
explicit Rails.logger calls is easily accomplished using the GELF gem and
lograge. Lograge builds one combined log entry for every request (instead of several lines like the
standard Rails logger) and has a Graylog output since version 0.2.0.
Start by adding Lograge and the GELF gem to your Gemfile:
gem "gelf"
gem "lograge"
Now configure both in your Rails application. Usually config/environments/production.rb is a good place for that:
config.lograge.enabled = true
config.lograge.formatter = Lograge::Formatters::Graylog2.new
config.logger = GELF::Logger.new("graylog.example.org", 12201, "WAN", { :host => "hostname-of-this-app", :facility => "heroku" })
This configuration will also send all explicit Rails.logger calls (e.g. Rails.logger.error "Something went wrong") to Graylog.
Log only explicit logger calls into Graylog
If you don’t want to log information about every request, but only explicit Rails.logger calls, it is enough to only configure the Rails logger.
Add the GELF gem to your Gemfile:
gem "gelf"
…and configure it in your Rails application. Usually config/environments/production.rb is a good place for that:
config.logger = GELF::Logger.new("graylog.example.org", 12201, "WAN", { :host => "hostname-of-this-app", :facility => "heroku" })
Heroku
You need to apply a workaround if you want custom logging on Heroku. The reason for this is that Heroku injects an own logger (rails_log_stdout),
that overwrites your custom one. The workaround is to add a file that makes Heroku think that the logger is already in your application:
$ touch vendor/plugins/rails_log_stdout/heroku_fix
Raw/Plaintext inputs
The built-in raw/plaintext inputs allow you to parse any text that you can send via TCP or UDP. No parsing is applied at all by default until you build your own parser using custom Extractors. This is a good way to support any text-based logging format.
You can also write Plugins if you need extreme flexibility.
JSON path from HTTP API input
The JSON path from HTTP API input is reading any JSON response of a REST resource and stores a field value of it as a Graylog message.
Example
Let’s try to read the download count of a release package stored on GitHub for analysis in Graylog. The call looks like this:
$ curl -XGET https://api.github.com/repos/YourAccount/YourRepo/releases/assets/12345
{
  "url": "https://api.github.com/repos/YourAccount/YourRepo/releases/assets/12345",
  "id": 12345,
  "name": "somerelease.tgz",
  "label": "somerelease.tgz",
  "content_type": "application/octet-stream",
  "state": "uploaded",
  "size": 38179285,
  "download_count": 9937,
  "created_at": "2013-09-30T20:05:01Z",
  "updated_at": "2013-09-30T20:05:46Z"
}
The attribute we want to extract is download_count so we set the JSON path to $.download_count.
This will result in a message in Graylog looking like this:
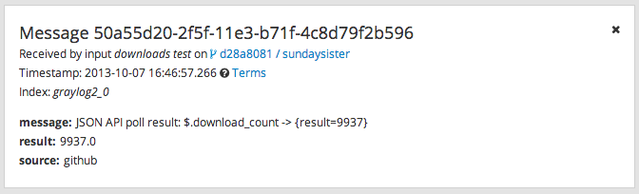
You can use Graylog to analyze your download counts now.
JSONPath
JSONPath can do much more than just selecting a simple known field value. You can for example do this to select the first download_count
from a list of releases where the field state has the value uploaded:
$.releases[?(@.state == 'uploaded')][0].download_count
…or only the first download count at all:
$.releases[0].download_count
You can learn more about JSONPath here.
Reading from files
Log files come in a lot of different flavors and formats, much more than any single program could handle.
To support this use case, we provide the Sidecar which acts as a supervisor process for other programs, such as nxlog and Filebeats, which have specifically been built to collect log messages from local files and ship them to remote systems like Graylog.
Of course you can still use any program supporting the GELF or syslog protocol (among others) to send your logs to Graylog.
Input Throttling
Throttling allows certain Graylog Inputs to slow their message intake rates (by temporarily pausing intake processing) if contention occurs in the Graylog Journal.
Graylog Inputs that support throttling
AWS Flow Logs
AWS Logs
CEF AMQP Input
CEF Kafka Input
GELF AMQP
GELF Kafka
JSON path from HTTP API
Raw/Plaintext AMQP
Raw/Plaintext Kafka
Syslog AMQP
Syslog Kafka
Enabling throttling
To enable throttling for one of these inputs, edit it in System > Inputs and check the Allow throttling this input checkbox.
Throttling criteria
When enabled, the following criteria will be used to determine if throttling will occur:
If there are zero uncommitted entries in the Graylog Journal, throttling will not occur. No further checks will be performed.
Throttling will occur if the Journal has more than 100k uncommitted entries.
Throttling will occur if the Journal is growing in size rapidly (approximately 20k entries per second or greater).
Throttling will occur if the process ring buffer is full.
Nothing is currently being written to the Journal, throttling will not occur. No further checks will be performed.
Throttling will occur if the Journal is more than 90% full.
Throttling will occur if the Journal write rate is more than twice as high as the read rate.